| News and Announcements » |
For this visualization, we will use the real edge table (real_edge_table.txt) and real node file (real_node_table.txt) that is generated by the make_otu_network.py script.
The (real_edge_table.txt) contains the columns “from”, “to”, “eweight” and “consensus_lin”, among others dictated by the headers in your mapping file. The edges (lines connecting the nodes) will span “from” the sample_ids “to” the otu_ids listed in the biom table. The (real_node_table.txt) will thus contain a node for every OTU and every sample in your study.
The following are the directions to use once Cytoscape is installed and open:
Select: real_edge_table.txt file. You’ll see a Preview of the table at the bottom of the window
Click: Show Text File Import Options
Click: Transfer first line as attribute names
Select: Source Interaction = Column 1
We want our Sources to be our Samples, i.e what is listed in the “from” column. Once selected, the “from” column should be highlighted in the Preview window
Our Targets will be the OTUs, i.e. what is listed in the “to” column
Click the headers for all other columns to import them (they will turn blue: note, might need to clicked more than once – you want to see a check mark next to the name instead of an X to know you have imported them successfully)
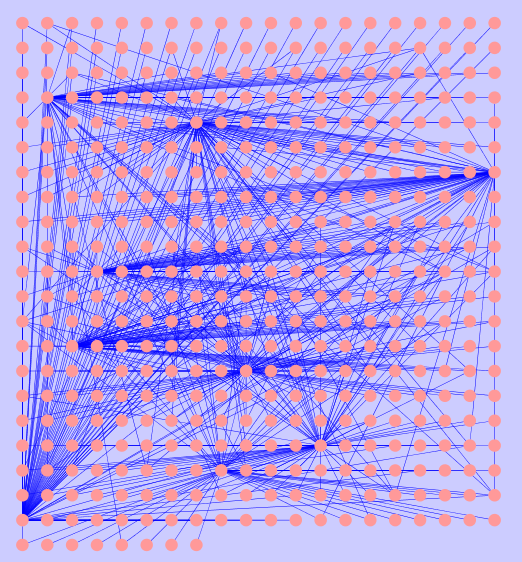
As a result, you should get successful import message. You should now see your network (as is shown below), though not in a particularly pretty format. You can use the roller button on your mouse to zoom in and out of the network. Next, we are going to import attributes for each of our nodes.
Select: real_node_table.txt file
Click: Show Text File Import Options
You should see check marks next to each of the headers in the Preview window. If not, click on the header until you get a check mark.
Click: Import
Click: VizMapper
Let’s color our Samples by Treatment, i.e. whether they are in the Control or Fasting group.
Click: Node Color
Double-Click to create…
- Click: Please select a value!
- Select: Treatment
- Click: Please select a mapping type!
- Select: Discrete
You should now see the Treatment groups of “Control”, “Fasting” or “otu” pop-up just below Node Color. Remember, the nodes in our network consist of both Samples and OTUs.
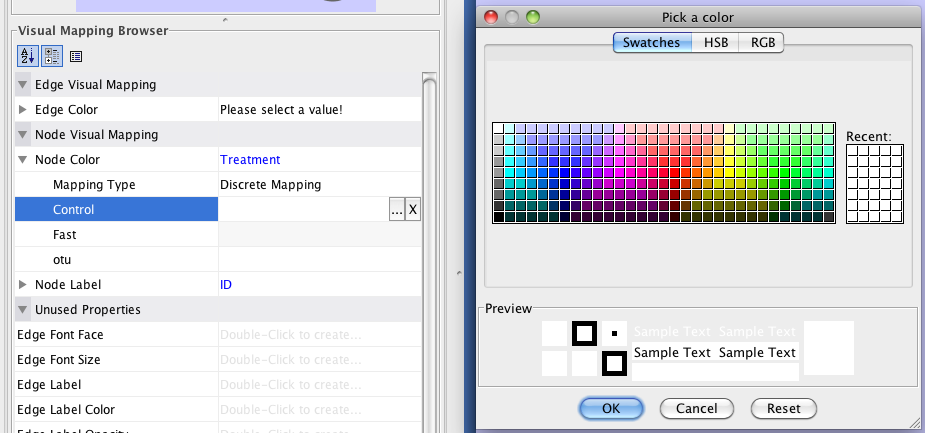
- Click: Control, then click on the “…” next to it
- This will bring up a Pick a Color window – let’s make the Control samples a blue. Click: OK
- Repeat this to make the Treatment samples bright green, and the otus white
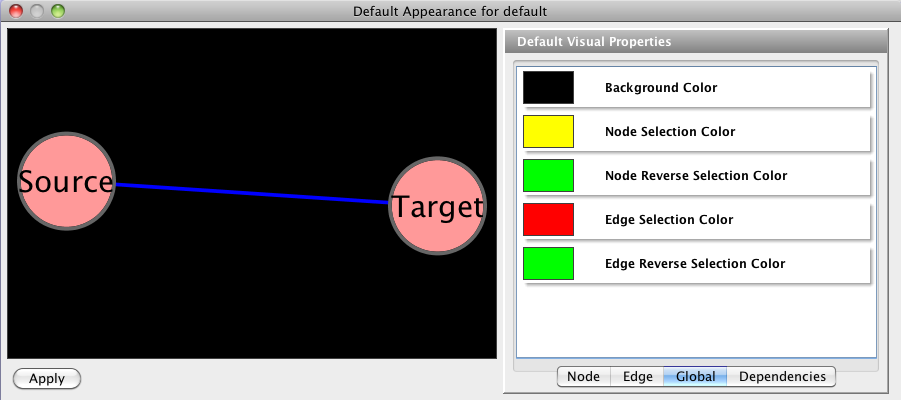
Click inside the Defaults window to bring up a “Default Appearance for default” window. Click on the Global tab, and change the background color to black. Click Apply.
- We can now change the Layout format. In the upper tool bar window, Select: Layout -> Cytoscape Layouts -> Edge-Weighted Spring Embedded -> eweights
- This may take a moment to process depending on the size of your network. Unfortunately, if your computer freezes on this step, there’s really nothing to do but restart Cytoscape and try again. Save often!
- Let’s change the size of our nodes. Select: Node Size.
- In more complicated datasets, it would be a very good idea to open up your real_node_table.txt in Excel and add in columns that will make it very easy to group items together, like Samples and OTUs. At the moment, we can click on LinkerPrimerSequence. This will group all the OTUs together vs. all the Samples, since in this case our samples have the same LinkerPrimerSequence.
- Make the samples size 50.0, and the otus size 10.0
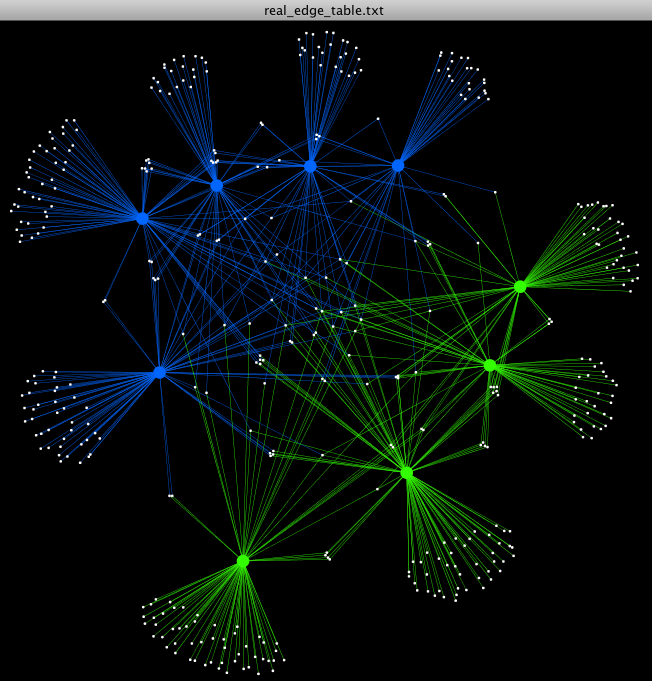
- Let’s change the edge colors connect our Treatment samples to their otus, and our Control samples to their otus. Select: Edge Color -> Treatment
- Mapping Type: Discrete Mapping
- Change the Control color to blue, and the Fast color to bright green.
- If you want to do anything more “custom”, you need to play around with your node and edge tables. For example, how can we color the otus that are shared between the Control and Fasting groups a different color than the otus that belong to just one treatment group? To do this, we can:
- Convert your biom table to a classic otu table using convert_biom.py
- Copy out all the OTU Ids seen in your study
- Open up your real_edge_table.txt in Excel
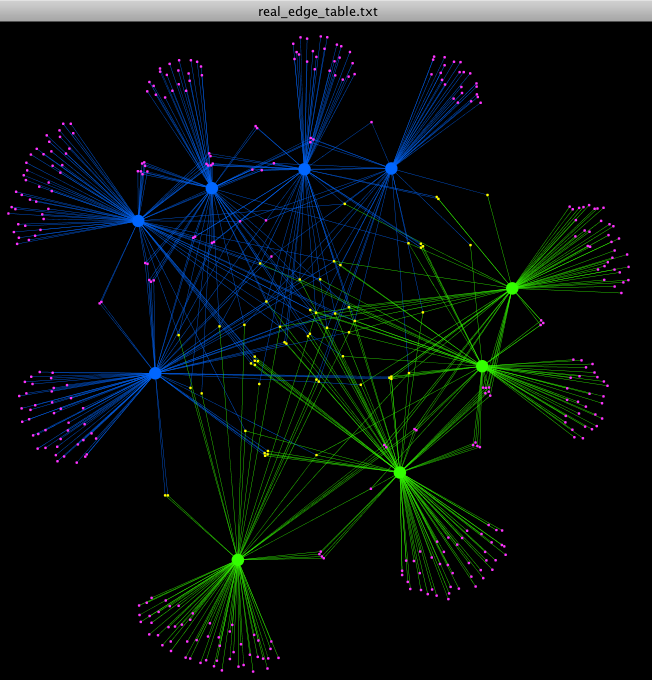
- Make a new excel sheet that contains where column A represents the OTUs seen in the Control group, column B represents the samples in Fasting group. In column C put your entire list of OTUs taken from the otu_table.txt. You can now use the COUNTIF function in Excel to find if each OTU is present in either the Control group only, the Fasting group only, or in both. With this information, make a new column in your real_node_table.txt where you label each OTU based on it being shared or not_shared, and each sample based on being a Control or Fasting sample. Now you can click on Node Color and color each individually. Here, we can see that the shared OTUs are colored yellow, and the not_shared OTUs are colored pink.
- As you can see in VizMapper, there are a multitude of options for coloring and otherwise changing your network. Have fun.