
| News and Announcements » |
This tutorial explains how to use several different distance matrix comparison techniques that are available in compare_distance_matrices.py. All of the currently available comparison techniques are based on the Mantel test, which is a non-parametric statistical method that computes the correlation between two distance matrices. In addition to this statistical method, QIIME also provides the partial Mantel test and Mantel correlogram. Each of these methods will be described in greater detail below.
One common application of distance matrix comparison techniques is to determine if correlation exists between a community distance matrix (e.g. UniFrac distance matrix) and a second matrix derived from an environmental parameter that is numeric/continuous in nature (e.g. difference in pH, temperature, or geographical location). For example, one might be interested in seeing if communities that are at dissimilar pH levels are more different from one another than communities that are at very similar pH levels. If so, this would indicate positive correlation between the two distance matrices. To create a distance matrix from a continuous category in your mapping file (e.g. environmental parameter), please refer to the distance_matrix_from_mapping.py script documentation.
Please note that this tutorial does not attempt to cover every possible option that can be used in the distance matrix comparison script. Instead, it attempts to provide useful examples to give you an idea of how to use these statistical methods in your own analysis, as well as customize some of the output to your liking. For a complete listing of the available options, please refer to the compare_distance_matrices.py script documentation.
You can obtain the files used in this tutorial here. The files are taken from a study (Lauber et al., 2009) where 88 soil samples were collected at various regions around the world. pH was recorded for each of the soil samples. Using distance_matrix_from_mapping.py, we created a distance matrix containing differences in pH between each pair of samples. Throughout this tutorial, we will explore various ways of comparing these matrices for correlation.
Depending on which statistical method you run, the output file(s) generated by this script will vary. They will all be placed in the directory specified by the required -o option. Most of the output files will be tab-separated text files containing information about the test that was performed and its results. These can easily be viewed in a spreadsheet program such as Excel.
The Mantel test tests the correlation between two distance matrices. It is non-parametric and computes the significance of the correlation through permutations of the rows and columns of one of the input distance matrices. The test statistic is the Pearson product-moment correlation coefficient r. r falls in the range of -1 to +1, where being close to -1 indicates strong negative correlation and +1 indicates strong positive correlation. An r value of 0 indicates no correlation.
To illustrate the use of the Mantel test, we will determine if there is significant correlation between the unweighted UniFrac distance matrix and the pH distance matrix. Run the following command:
compare_distance_matrices.py --method=mantel -i unweighted_unifrac_dm.txt,PH_dm.txt -o mantel_out -n 999
This command will create a new output directory named mantel_out, which will contain a single text file called mantel_results.txt. Open up mantel_results.txt to see the results of the test:
Note
The Mantel r statistic of 0.75592 indicates that there is relatively strong positive correlation between the UniFrac and pH matrices. The p-value of 0.001 indicates that our results are statistically significant at an alpha of 0.05. We determined the p-value by specifying 999 permutations with the -n option. By default, the p-value is calculated using a two-tailed test, though this can be changed using the -t option.
This script also has a “batch” mode where you may specify more than two distance matrices as input. A separate Mantel test will be performed for each pair of distance matrices. Run the following command:
compare_distance_matrices.py --method=mantel -i unweighted_unifrac_dm.txt,unweighted_unifrac_dm_shuffled.txt,PH_dm.txt -o mantel_out -n 999
Again, open up mantel_out/mantel_results.txt to see the results of the test:
Note
We specified three distance matrices in the previous command. Two of the distance matrices are the same ones we previously used and we added a third new distance matrix called unweighted_unifrac_dm_shuffled.txt. This distance matrix is the same as the original unweighted UniFrac distance matrix except its sample IDs are shuffled. This distance matrix is included to illustrate a negative control, i.e. one that should not be correlated with either of the other two distance matrices. The results file indicates that there isn’t significant correlation between the original and shuffled UniFrac distance matrices because the Mantel r statistic is close to zero and the p-value is very large (0.659). The middle line in the results file is the same as our previous results (strong significant positive correlation). The last line indicates that the shuffled UniFrac and pH distance matrices are not significantly correlated.
The partial Mantel test is used to estimate the correlation between two matrices, A and B, while controlling for the effect of a control matrix C. The partial Mantel test is a first-order correlation analysis that utilizes three distance (dissimilarity) matrices. This test builds on the simple Mantel test by adding a third “control” matrix. The goal is to test the correlation between matrices A and B while controlling the effect of a third matrix C, in order to remove spurious correlations. The first distance matrix is the one that is permuted so that the correlation structure between the first and second distance matrices is kept constant (Oksanen et al., 2011). A popular use of the partial Mantel test is to compare a community distance matrix with another distance matrix derived from an environmental parameter, using geographic distance as the third “control” distance matrix.
To illustrate the use of the partial Mantel test, we will determine if there is significant correlation between the unweighted and weighted UniFrac distance matrices, using the pH distance matrix as the control matrix. Run the following command:
compare_distance_matrices.py --method=partial_mantel -i unweighted_unifrac_dm.txt,weighted_unifrac_dm.txt -c PH_dm.txt -o partial_mantel_out -n 999
This command will create a new output directory named partial_mantel_out, which will contain a single text file called partial_mantel_results.txt. Open up partial_mantel_results.txt to see the results of the test:
Note
The Mantel r statistic of 0.68183 indicates that there is relatively strong positive correlation between the unweighted and weighted UniFrac distance matrices while controlling for differences in pH. The p-value of 0.001 indicates that our results are statistically significant at an alpha of 0.05. As with the Mantel test (above), we can also specify more than two distance matrices as inputs, and separate partial Mantel tests will be performed for all pairs of input distance matrices, using the same control matrix for each test.
Mantel correlogram tests whether there is correlation between two distance matrices by measuring the correlation between each class of distances. Mantel correlogram performs a Mantel test on each distance class and generates a correlogram with distance classes on the x-axis and their corresponding Mantel test statistic on the y-axis. The shape of the correlogram can then be analyzed to determine the underlying correlative structure that exists between the two input distance matrices. Mantel correlogram is typically used as an auxiliary method to the traditional Mantel test. Thus, the Mantel test is used to check for overall significant correlation between two distance matrices, and Mantel correlogram can then be used to further investigate the underlying structure of the correlative relationship.
Sturge’s rule is used to determine the number of distance classes based on the number of pairwise comparisons that are possible in the input distance matrices. These distance classes can be thought of as bins (as used in histograms). For each distance class, a Mantel test is performed and a Mantel r statisic is computed. A corrected p-value (i.e. Bonferroni, FDR, Holm, etc.) is also computed for each test. The results of this method are usually visualized in a correlogram, which is a graph with the geographic/environmental distance classes on the x-axis and the Mantel statistics on the y-axis.
As previously stated, the shape of the correlogram determines the underlying structure of the correlative relationship. For example, different correlogram shapes indicate whether the correlation exists as a linear gradient, a single bump, multiple bumps, a “nugget” effect, and so on. This tutorial does not attempt to illustrate or explain all possible types of correlograms. We refer the reader to Legendre and Legendre (1998) for an excellent discussion of how to interpret correlograms.
To illustrate the use of the Mantel correlogram method, we will determine the underlying correlative structure between unweighted UniFrac distance and difference in pH. Since we previously obtained significant results from the traditional Mantel test, it is appropriate to use Mantel correlogram for further investigation. Run the following command:
compare_distance_matrices.py --method=mantel_corr -i unweighted_unifrac_dm.txt,PH_dm.txt -o mantel_correlogram_out -n 999
This command will create a new output directory named mantel_correlogram_out, which will contain two files called mantel_correlogram_results.txt and unweighted_unifrac_dm.txt_AND_PH_dm.txt_mantel_correlogram.pdf. Open up mantel_correlogram_results.txt to see the results of the test:
Note
The results file contains information about which two distance matrices were compared, how many entries (i.e. samples) were in each, and the number of permutations used to compute the p-values. The class index indicates the midpoint of each distance class derived from the second distance matrix (in this case, PH_dm.txt). The next column contains the number of distances in each distance class. The Mantel r statistic denotes the strength of the correlation for the distance class, and the p-value and Bonferroni-corrected p-value indicate the significance of the test.
Open up unweighted_unifrac_dm.txt_AND_PH_dm.txt_mantel_correlogram.pdf to view the Mantel correlogram:
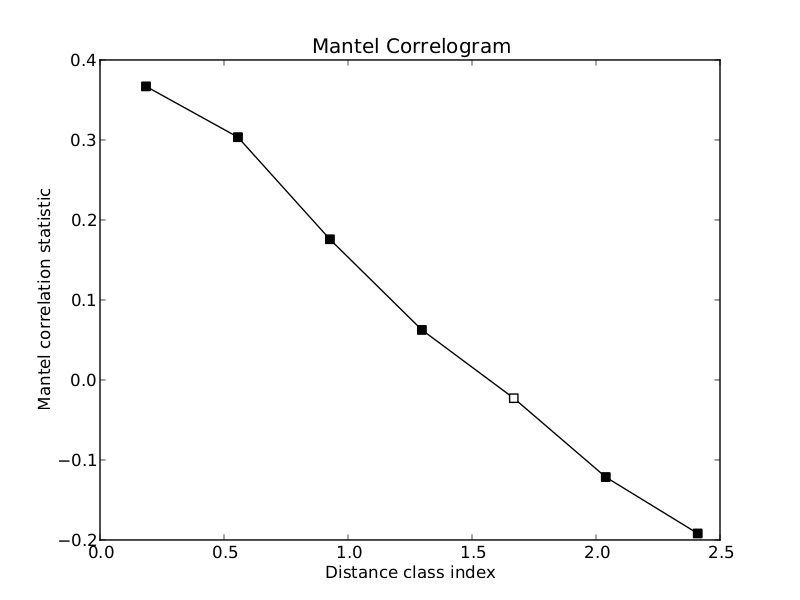
The correlogram is a visual representation of the results in the output text file that we just examined. The x-axis is the distance class indices and the y-axis is the Mantel r statistic. Points that are filled in (black) are statistically significant at an alpha of 0.05 (this can be changed with the -a option). Points that are not filled in (white) are not statistically significant at the specified alpha level. By examining the shape of the correlogram, we see that the underlying correlative structure is a linear gradient. Also note that most of the points in the correlogram are statistically significant. The default output format for the correlogram plot is PDF, but this can be changed to PNG or SVG using the -g option.
Lauber, Christian L et al. “Pyrosequencing-based assessment of soil pH as a predictor of soil bacterial community structure at the continental scale.” Applied and environmental microbiology 75.15 (2009): 5111-5120.
Legendre, P., Legendre, L. Numerical Ecology Second English Edition (1998).
Oksanen, Jari et al. vegan: Community Ecology Package. R package version 2.0-3 (2012). http://CRAN.R-project.org/package=vegan